5.5.3. Visualizing the action sequence
Another handy feature is the ability to generate a visual graph of the actions needed, using the
--dot-file option. This relies on the separate Graphviz
project.
Example 5.10. Generate a visual graph of cluster actions from a saved CIB
crm_simulate --simulate --xml-file $FILENAME --dot-file $FILENAME.dot
dot $FILENAME.dot -Tsvg > $FILENAME.svg
$FILENAME.dot will contain a GraphViz representation of the cluster’s response to your changes, including all actions with their ordering dependencies.
$FILENAME.svg will be the same information in a standard graphical format that you can view in your browser or other app of choice. You could, of course, use other dot options to generate other formats.
How to interpret the graphical output:
Bubbles indicate actions, and arrows indicate ordering dependencies
Resource actions have text of the form resource_action_interval node indicating that the specified action will be executed for the specified resource on the specified node, once if interval is 0 or at specified recurring milliseconds interval otherwise
Actions with black text will be sent to the executor (that is, the appropriate agent will be invoked)
Actions with orange text are "pseudo" actions that the cluster uses internally for ordering but require no real activity
Actions with a solid green border are part of the transition (that is, the cluster will attempt to execute them in the given order — though a transition can be interrupted by action failure or new events)
Dashed arrows indicate dependencies that are not present in the transition graph
Actions with a dashed border will not be executed. If the dashed border is blue, the cluster does not feel the action needs to be executed. If the dashed border is red, the cluster would like to execute the action but cannot. Any actions depending on an action with a dashed border will not be able to execute.
Loops should not happen, and should be reported as a bug if found.
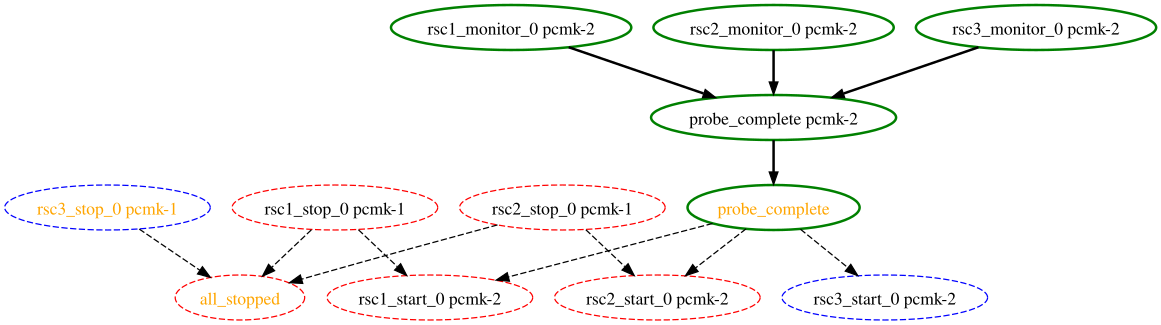
Example 5.11. Small Cluster Transition
In the above example, it appears that a new node, pcmk-2, has come online and that the cluster is checking to make sure rsc1, rsc2 and rsc3 are not already running there (indicated by the rscN_monitor_0 entries). Once it did that, and assuming the resources were not active there, it would have liked to stop rsc1 and rsc2 on pcmk-1 and move them to pcmk-2. However, there appears to be some problem and the cluster cannot or is not permitted to perform the stop actions which implies it also cannot perform the start actions. For some reason, the cluster does not want to start rsc3 anywhere.
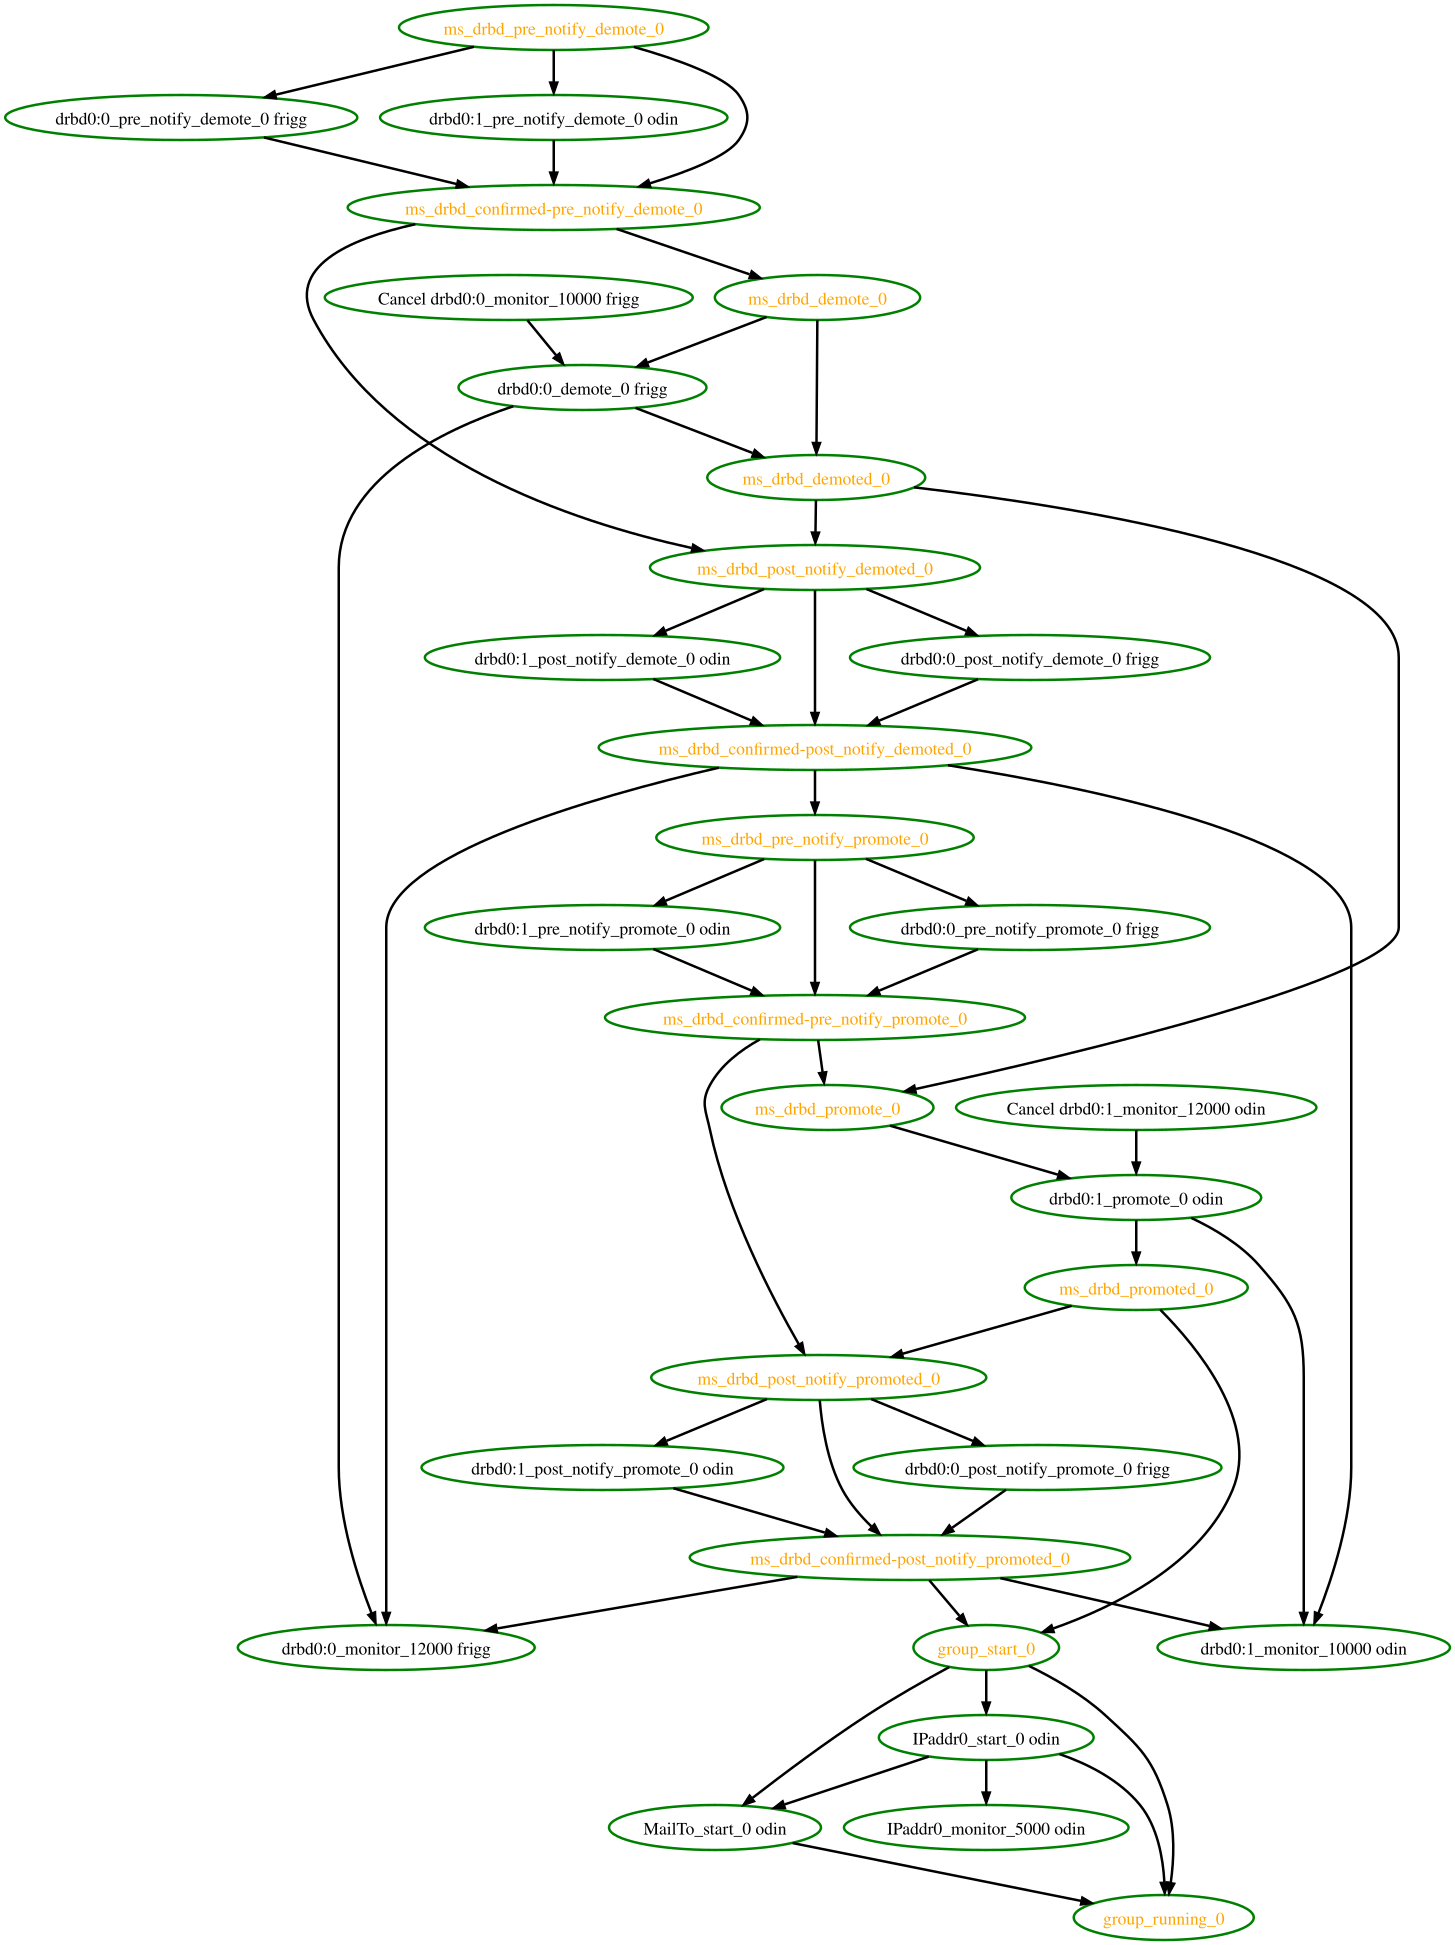
Example 5.12. Complex Cluster Transition